 会员权益
会员权益
1.66/天
20款工具免费
每日投递项目无限制
项目较优先处理
单个文件上传最大值为1024M
支付后请等待几秒左右系统将自动入款!
-60x60-fit.png)
引用OmicShare Tools的参考文献为:
Mu, Hongyan, Jianzhou Chen, Wenjie Huang, Gui Huang, Meiying Deng, Shimiao Hong, Peng Ai, Chuan Gao, and Huangkai Zhou. 2024. “OmicShare tools: a Zero‐Code Interactive Online Platform for Biological Data Analysis and Visualization.” iMeta e228. https://doi.org/10.1002/imt2.228发表期刊:Ecotoxicology and Environmental Safety
影响因子:6.8
发表时间:2022
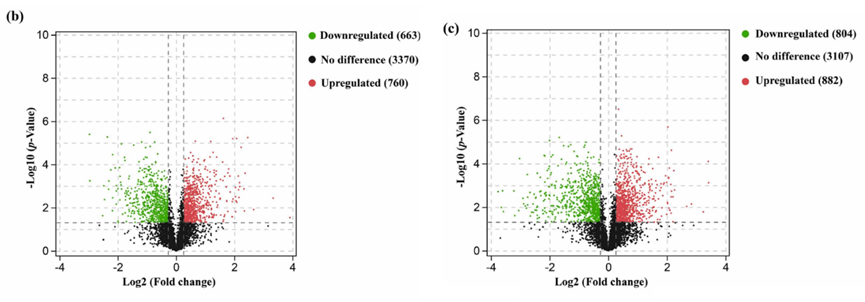
Fig. 4. b&c, Volcano plots of protein quantifications in CK group (b) and AZA exposure group (c), respectively, and the logarithmic fold changes of iTRAQ quantification intensities were plotted by the negative decadic logarithm of the p value. The number of up-/down-regulated DAPs was obtained by comparing the protein abundance in adult ovary with that in pupal ovary in S. litura under normal and AZA exposure condition, respectively.
引用方式:
Volcano plots were performed using the OmicShare tools (https://www.omicshare.com/tools) with default settings.
参考文献:
Sun R, Xu Y, Liu J, et al. Proteomic profiling for ovarian development and azadirachtin exposure in Spodoptera litura during metamorphosis from pupae to adults[J]. Ecotoxicology and Environmental Safety, 2022, 237: 113548.
发表期刊:Frontiers in Molecular Neuroscience
影响因子:4.8
发表时间:2022
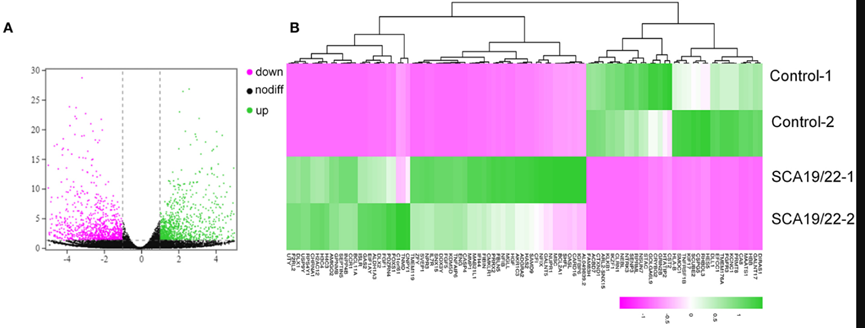
FIGURE 5. A visualization of the transcriptome data analysis. The volcano map (A) and heatmap (B) of the gene expression. The red gene is upregulated and the green gene is downregulated. |log2 (FC)| >1 is considered to be significant.
引用方式:
We drew the volcano map and the heatmap of the DEGs using the OmicShare tools(www.omicshare.com/tools).
参考文献:
Li M, Liu F, Hao X, et al. Rare KCND3 Loss-of-Function mutation associated with the SCA19/22[J]. Frontiers in Molecular Neuroscience, 2022, 15: 919199.
案例3:
发表期刊:Journal of agricultural and food chemistry
影响因子:6.1
发表时间:2020
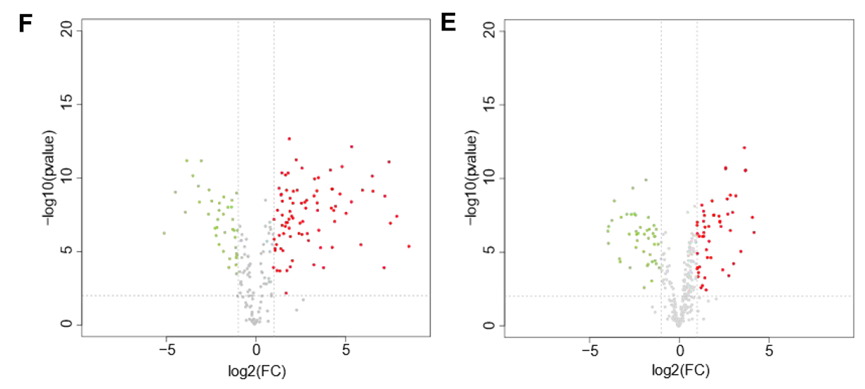
Figure 5. Characterization of PCH, FCH, and P-FCH in terms of amino acid and peptide profiles. (E) Volcano plot of peptides in PFCH vs PCH (red dots denote upregulation, and green dots denote downregulation). (F) Volcano plot of peptides in P-FCH vs FCH (red dots denote upregulation, and green dots denote downregulation).
引用方式:
The distribution of peptides in each hydrolysate was analyzed by an UpSet Venn diagram (http://www.omicshare.com/ tools). Variation analysis of the peak areas in common peptides was shown by the volcano plot (http://www.omicshare.com/tools).
参考文献:
Wang C, Zheng L, Su G, et al. Evaluation and exploration of potentially bioactive peptides in casein hydrolysates against liver oxidative damage in STZ/HFD-induced diabetic rats[J]. Journal of agricultural and food chemistry, 2020, 68(8): 2393-2405.
案例4:
发表期刊:Infection and Drug Resistance
影响因子:3.9
发表时间:2022
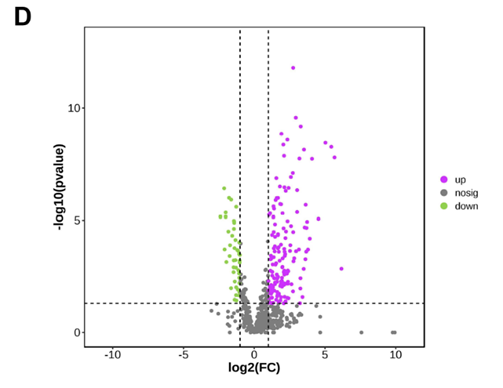
Figure 2 Data quality control and differential screening. (D) volcano plot showing up-regulated (purple) and down-regulated (green) proteins screened by differential analysis, with the logarithm of the difference multiplicity (log2) as the horizontal coordinate and the negative logarithm of the p-value (log10) as the vertical coordinate.